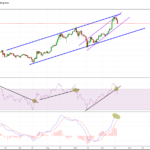
One of the few juniors that have been going up while the overall sector has been going down. About a 50% gain since I published my company report. They will be aggressively drilling in 2018.
Continue reading » January 17, 2018 admin Chart of the Day No Comment A lot of the “twitter traders” I follow seem to have been bearish gold and the miners for quite some time (even expecting a crash), and more are joining the choir every passing day. Personally I am still 100% allocated based on my charts because the...
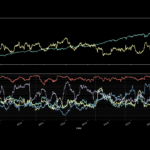
Continue reading » January 17, 2018 admin Chart of the Day No Comment I have been coding a lot these last few weeks and I have created a script that tracks rolling correlations for a given asset. I also created a “Psychology/Dislocation Index” in order to measure how dislocated an asset is from some of the typical asset...
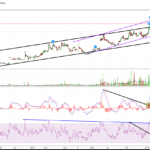
Continue reading » January 16, 2018 admin Chart of the Day, Uncategorized No Comment GLD (Gold): It sure looks like a bull market I must say. We are at a very very very interesting spot right now since we are close to potentially breaking the multi year resistance line in purple. MACD is also close to a...
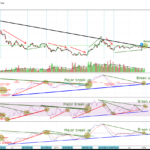
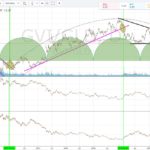
Continue reading » January 14, 2018 admin Chart of the Day, Gold, Gold & Silver Stocks, Silver 2 Comments Major support and resistance breaks in this chart has signalled major trends in gold and the miners during the last couple of years. We seem to be on the cusp of another perhaps important break down. Last time the GVI/GLD ratio broke major support,...
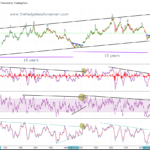
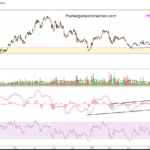
Continue reading » January 11, 2018 admin Chart of the Day No Comment The following chart is very interesting to say the least. We should be near or at the green trend line that has been a resistance/pivot zone multiple times during the this “FIAT only” regime. Sure, gold is not as cheap as when it hit the...
Continue reading » January 4, 2018 admin Chart of the Day, Gold No Comment A few days ago I posted the graph seen below and suggested that we were in for some pain in the mining space. So far it has been going according to plan, with both metals and miners nosediving since the start of the week. I...
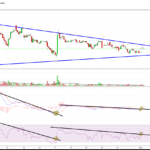
Continue reading » December 8, 2017 admin Chart of the Day No Comment We should see some wild movements pretty soon. RSI and MACD are suggesting that the large wedge will be broken to the upside. [yop_poll id=”1″]
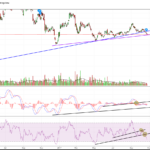
Continue reading » November 1, 2017 admin Chart of the Day, Gold & Silver Stocks, Horseman's Portfolio No Comment First price chart trend line broken. MACD has broken first trend line. RSI has broken two trend lines. Hopefully this turns out like the scenario I described a few months ago: Blood bath phase breaking all technical supports exactly like before the huge Q1 rally...
Continue reading » October 25, 2017 admin Chart of the Day, Gold & Silver Stocks No Comment I personally do not own any Bitcoin (or any crypto “currency”) but I do follow it from time to time because it has shown to react to certain geopolitical events. MACD-line has turned and is signalling some kind of top. (Short term bearish)...
Continue reading » October 18, 2017 admin Chart of the Day No Comment 