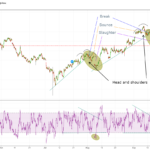
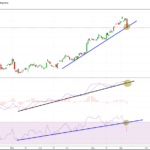
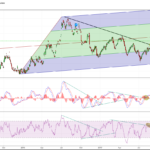
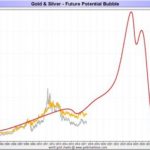
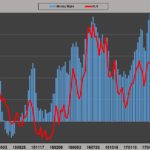
Investors are basically “all in”… And this sentiment indicator has never been higher… While the combined world stock market cap has never been higher: The question is then… Who is left to buy? My personal take after seeing how robotic...
Continue reading » September 22, 2017 admin Chart of the Day 1 Comment Hopefully we will make some kind of bottom around today’s levels. Some junior miners suffered declines that smells a bit like capitulation selling. Looks like we have seen this action before, not too long ago…
Continue reading » September 18, 2017 admin Chart of the Day No Comment Copper looks to be breaking a lot of multi month trend lines today (bearish). We should know next week if this is a start of a real correction following the simply stunning rally since June of this year. Personally I would take some profits off...
Continue reading » September 8, 2017 admin Chart of the Day No Comment Even though the rally in precious metals has already run for quite some time, silver is looking very interesting in terms of more upside potential ahead: Gold-Silver ration rolling over…?
Continue reading » September 7, 2017 admin Chart of the Day, Gold, Silver No Comment
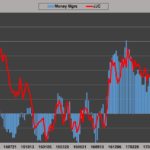
Continue reading » August 30, 2017 admin Chart of the Day, Gold No Comment Money Managers (semi dumb money) net long positions at 2 year highs (at least): Chinese Credit Creation vs Copper: … These are huge warning signs for investors that are long copper. Zerohedge recently posted an article titled “Something Strange Is Going...
Continue reading » August 23, 2017 admin Chart of the Day No Comment I have been reading a bunch of negative comments regarding gold lately. This Isn’t that surprising since first of all, the COT -report showed managed money (semi dumb money) pushing up their net long positions past recent highs: Friday also delivered a VERY ugly “shooting...
Continue reading » August 20, 2017 admin Chart of the Day, Gold, Silver 1 Comment This past week ended on a negative note for the mining indices since GDX and GDXJ seem to have been rejected at the down trend ceiling once again (even though some big individual names have pretty bullish charts): GDXJ:GDX Isn’t looking that great...
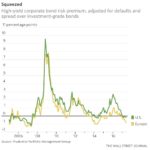
Continue reading » August 5, 2017 admin Chart of the Day, Gold & Silver Stocks No Comment There is nothing normal or rational about this chart at all. This chart is reflecting a world where central banks have distorted and destroyed any idea of a functioning market by taking rates to zero (or even sub zero), while suppressing bond yields through...
Continue reading » July 18, 2017 admin Chart of the Day, Gold, Silver, The Economic Depression No Comment – Source: David Brady ( https://twitter.com/GlobalProTrader ) These values are not that different from when the last major bottom took place…
Continue reading » July 3, 2017 admin Chart of the Day, Gold, Gold & Silver Stocks, Silver No Comment 