Charts of The Day: Gold, Silver and EUR/USD
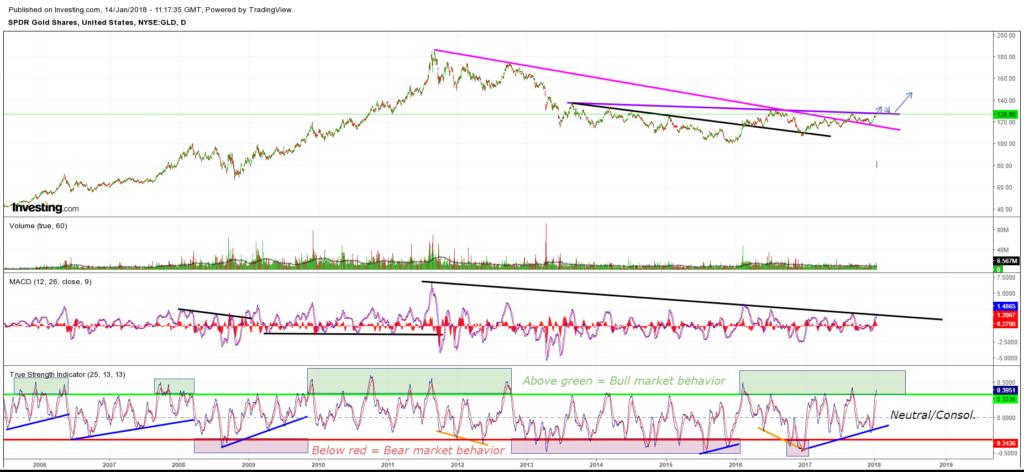
- GLD (Gold):
It sure looks like a bull market I must say. We are at a very very very interesting spot right now since we are close to potentially breaking the multi year resistance line in purple. MACD is also close to a long term bullish break out. If we do break the resistance lines, then we will probably head to around $1,400 at least IMHO. We might not clear the purple line on the first attempt, but given how lousy the dollar ended last week I think we have a fair chance at least.
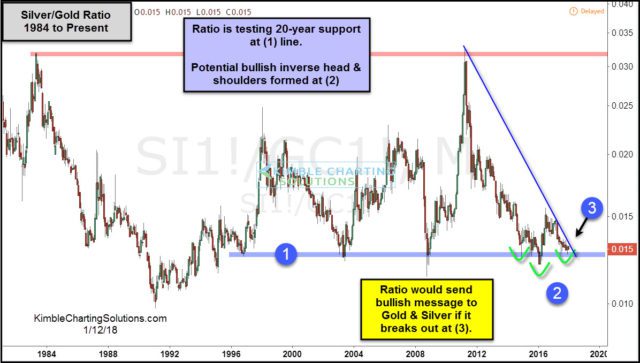
- Silver/Gold ratio:
Does look dangerous… In a good way!
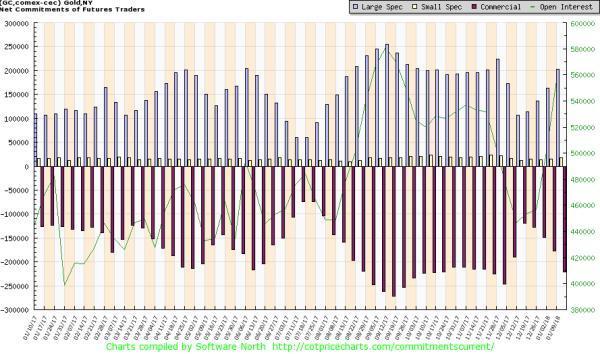
- COT Report (Gold):
COT not looking great, but have some room to run yet. Best case would of course to have the commercials finally capitulating and having to cover their shorts… But that entails a shift which probably isn’t wise to bet on.
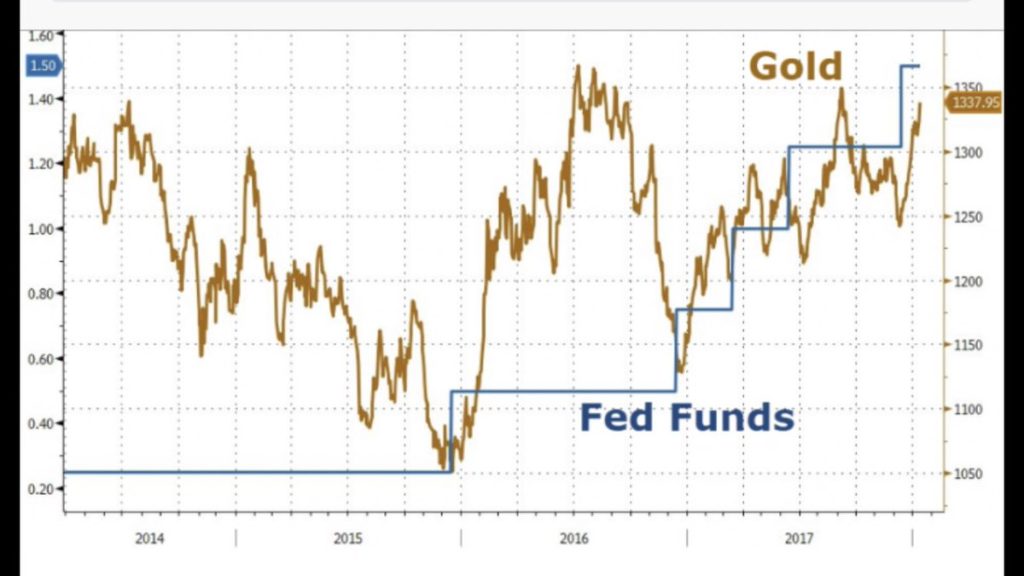
- Gold and FED Funds rate:
“Rate hikes are always bad for gold”.
- EURO/USD:
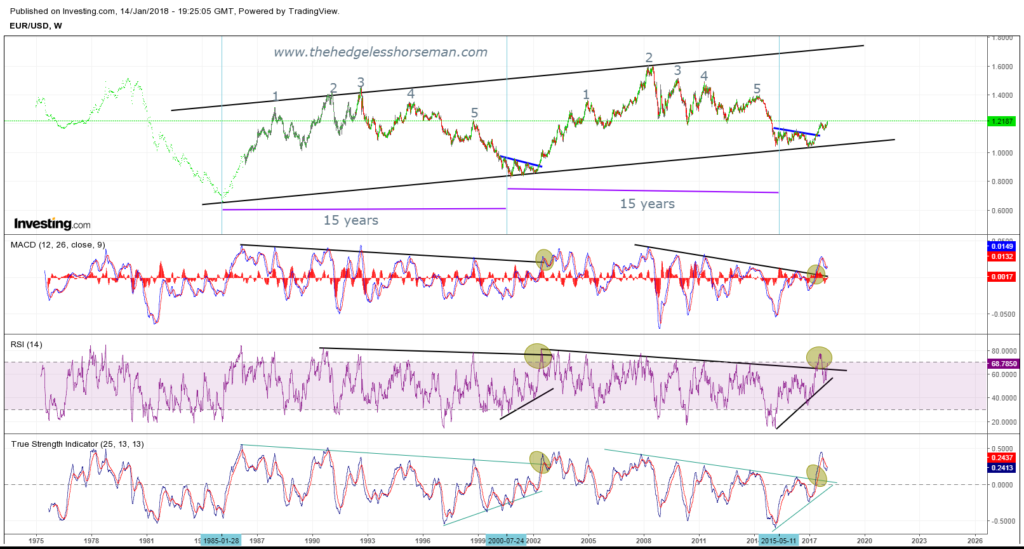
Now this is one of the prettiest charts I have put together lately (almost too pretty!?). Even though the COT-report is not looking pretty at all, I must say that the EUR/USD chart looks bullish as hell, at least mid to long term. Almost an exact replica of the prior 15 year cycle for the Euro. This chart alone makes it hard for me to understand how a lot of traders can be so bullish on the dollar (and bearish gold).
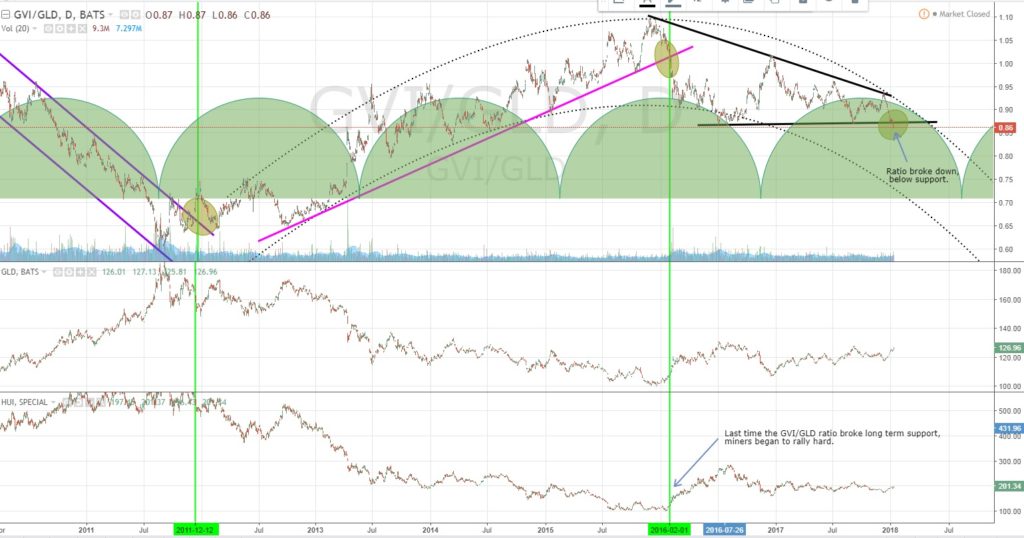
- Lastly I would also point out the GVI/GLD chart I have been following, which is now finally signalling that the miners could/should be ready to rip:
To sum up:
- Gold is at a critical juncture.
- Gold COT is somewhat bearish.
- Silver/Gold ratio is at a critical juncture.
- EUR/USD looks very bullish, at least mid term (bearish for the dollar).
- GVI/GLD ratio has broken support and is suggesting miners could/should begin to rip.
To the above I would add that the miners have been lagging big time lately and that they are certainly not priced for $1,338 gold IMHO. That is a plus for gold stock heavy portfolios in terms of margin of safety. If gold does indeed “crash” as some are suggesting, the fall in the miners should be somewhat muted at least. On the other hand, if the GVI/GLD ratio is “right”, then it would mean that we will indeed see miners begin to rally shortly, and that would suggest that gold will also break through the purple trend line. In that case I can certainly see a rather violent rally for the miners given that they then would have a LOT of catching up to do.
Best regards,
The Hedgeless Horseman
Follow me on twitter: https://twitter.com/Comm_Invest
Follow me on CEO.ca: https://ceo.ca/@hhorseman
Don’t forget to sign up for my Newsletter (top right on front page) in order to get notification when a new post is up!
Disclaimer: This article should not be considered investment or trading advice. There are no guarantees in the markets. A trend can reverse any time and prior asset/ratio relationships vary over time.




Hi
I think I’m signed up to get notice of new issues, but I’m not getting any. I checked spam folder – nothing.
Hi J,
I think it’s my web service provider that has it auto blocked as “spam” and won’t let the emails go out unfortunately. I am currently looking into it!
Best regards,
THH