Eskay Mining Encounters 1.51 gpt Au and 25.39 gpt Ag over 43.1m and 2.84 gpt Au and 22.17 gpt Ag over 16.4m in Extensional Drilling at the TV Deposit, Consolidated Eskay Project, Golden Triangle, BC
TORONTO, ON / ACCESSWIRE / February 23, 2023 / Eskay Mining Corp. (“Eskay” or the “Company”) (TSXV:ESK) (OTCQX:ESKYF) (Frankfurt:KN7)(WKN:A0YDPM) is pleased to announce further encouraging diamond drill results from its 2022 exploration program at its 100% controlled Consolidated Eskay Property in the Golden Triangle, British Columbia.
“Results from our 2022 exploration season demonstrate Eskay’s team has made considerable progress toward unraveling the district-scale potential of VMS mineralization surrounding the Eskay Creek deposit,” commented Dr. John DeDecker, VP of Exploration for Eskay Mining Corp. “Achievements of the 2022 exploration program include defining a new trend of VMS mineralization along the Scarlet-Tarn corridor parallel to and approximately seven kilometers east of the Eskay anticline. Tarn Lake and Scarlet Knob are situated along an east-west trending VMS feeder structure hosted by Eskay rhyolite like that seen in the footwall of the Eskay Creek deposit. Mapping and prospecting define a westward stratigraphic younging direction suggesting that stockwork and replacement-style mineralization at Tarn Lake may represent feeders to seafloor-hosted mineralization up-section towards the important Contact Mudstone horizon, host to high-grade mineralization at Eskay Creek. This recognition is a significant step towards meeting our goal of discovering new Eskay Creek-like high-grade VMS systems. Drilling at TV now shows that Au- and Ag-bearing massive sulfide extends 100 m along strike and overlies an even more extensive zone of stockwork mineralization. We are eager to follow up on all of these encouraging results in 2023.”
TV Extensional Drilling
Highlight results:
- 4.61 gpt Au and 22.17 gpt Ag (4.89 gpt Au Eq) over 6.28m within 2.84 gpt Au and 22.17 gpt Ag (3.13 gpt Au Eq) over 16.36m in hole TV22-105
- 2.66 gpt Au and 30.45 gpt Ag (3.05 gpt Au Eq) over 10.56m within 1.51 gpt Au and 25.39 gpt Ag (1.83 gpt Au Eq) over 43.09m in hole TV22-120
- 3.36 gpt Au and 109.50 gpt Ag (4.76 gpt Au Eq) over 2.00m within 1.14 gpt Au and 30.40 gpt Ag (1.53 gpt Au Eq) over 30.56m in hole TV22-97
- 6.88 gpt Au and 21.00 gpt Ag (7.15 gpt Au Eq) over 1.10m within 1.28 gpt Au and 87.92 gpt Ag (2.41 gpt Au Eq) over 14.95m in hole TV22-109
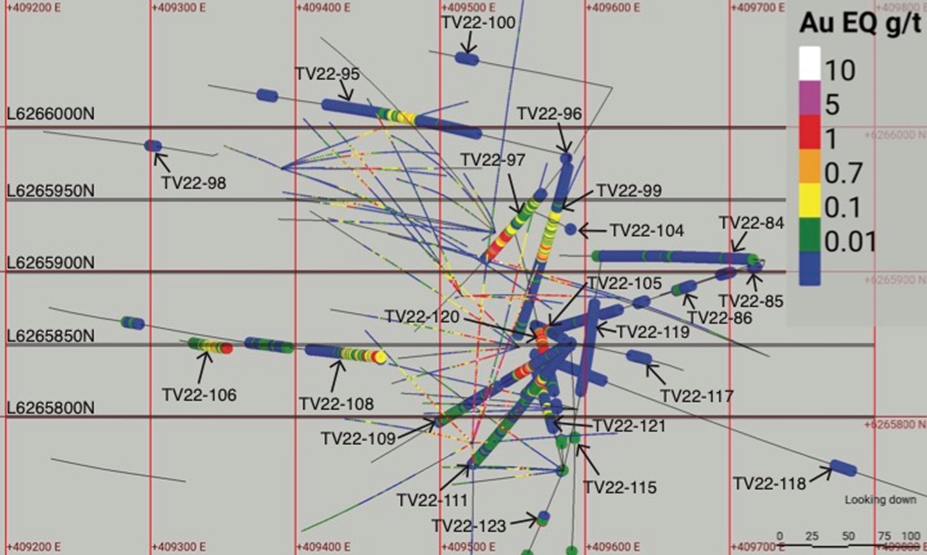
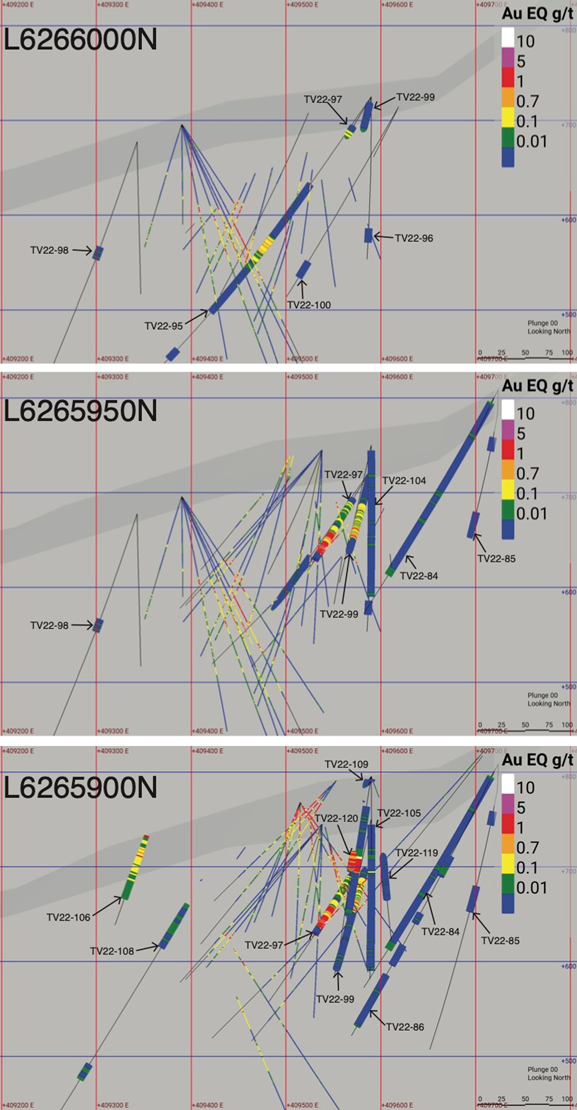
Drilling at TV in 2022 expanded the footprint of both the Upper Massive Sulfide Zone and Stockwork Zone at TV (Figures 1, 2 and 3). Massive sulfide mineralization now extends approximately 100 m along strike, ranges from 5 to 10 m in thickness, and is characterized by sulfide lenses hosted by intensely silicified carbonaceous mudstone associated with peperitic dacite (Figures 4 and 5). Massive and semi-massive sulfide mineralization overlies an extensive stockwork feeder zone hosted by dacitic and andesitic breccia and peperite. Stockwork mineralization now extends approximately 175 m along strike, 175 m down dip, and ranges in thickness from 50 to 100 m. Significantly, drill holes testing the up-dip extent of the stockwork zone (TV22-106, 108, and 112) intercepted strongly anomalous Au and Ag values with interspersed values over 1 gpt Au equivalent. Rock chip samples collected from the vicinity of these drill holes suggest that this up-dip zone may contain higher grade pockets of Au and Ag mineralization (Figure 2).
Significant mineralized intervals from 2022 drill holes completed in the vicinity of the TV deposit are presented in the table below. A complete list of the coordinates of drill holes including holes without significant mineralized intercepts is found at the bottom of this release.
| Hole | From (m) | To (m) | Length (m) | Au (gpt) | Ag (gpt) | Au Eq (gpt) | Ag Eq (gpt) |
| TV22-88 | 133.30 | 135.00 | 1.70 | 1.22 | 1.22 | 1.24 | 96.38 |
| TV22-97 | 95.44 | 126.00 | 30.56 | 1.14 | 30.40 | 1.53 | 119.68 |
| includes | 114.00 | 116.00 | 2.00 | 3.36 | 109.50 | 4.76 | 371.58 |
| TV22-99 | 88.72 | 93.60 | 4.88 | 0.70 | 23.50 | 1.00 | 78.17 |
| 97.64 | 103.34 | 5.70 | 1.77 | 19.46 | 2.02 | 157.82 | |
| includes | 102.55 | 103.34 | 0.79 | 8.85 | 23.00 | 9.14 | 713.30 |
| TV22-105 | 86.72 | 103.08 | 16.36 | 2.84 | 22.17 | 3.13 | 243.78 |
| includes | 86.72 | 93.00 | 6.28 | 4.61 | 22.17 | 4.89 | 381.59 |
| and | 96.00 | 101.00 | 5.00 | 2.39 | 25.40 | 2.71 | 211.66 |
| TV22-106 | 2.56 | 4.60 | 2.04 | 1.69 | 2.38 | 1.72 | 134.20 |
| 24.91 | 26.91 | 2.00 | 0.78 | 17.50 | 1.00 | 78.30 | |
| TV22-108 | 4.20 | 6.99 | 2.79 | 1.94 | 6.00 | 2.02 | 157.32 |
| 15.00 | 18.00 | 3.00 | 1.33 | 2.17 | 1.36 | 105.76 | |
| TV22-109 | 50.05 | 65.00 | 14.95 | 1.28 | 87.92 | 2.41 | 188.00 |
| includes | 50.05 | 51.15 | 1.10 | 6.88 | 21.00 | 7.15 | 557.64 |
| and | 57.58 | 63.23 | 5.65 | 1.03 | 173.12 | 3.25 | 253.38 |
| TV22-110 | 72.27 | 88.95 | 16.68 | 1.44 | 19.62 | 1.69 | 131.55 |
| TV22-111 | 51.56 | 58.78 | 7.22 | 0.45 | 92.99 | 1.64 | 127.96 |
| includes | 54.83 | 56.51 | 1.68 | 0.87 | 309.00 | 4.84 | 377.21 |
| TV22-112 | 0.00 | 7.00 | 7.00 | 0.75 | 9.31 | 0.87 | 68.05 |
| includes | 4.00 | 5.00 | 1.00 | 3.57 | 8.18 | 3.67 | 286.64 |
| TV22-120 | 127.79 | 170.88 | 43.09 | 1.51 | 25.39 | 1.83 | 142.83 |
| includes | 130.18 | 131.00 | 0.82 | 4.19 | 15.00 | 4.38 | 341.82 |
| and | 136.58 | 147.14 | 10.56 | 2.66 | 30.45 | 3.05 | 238.18 |
| TV22-121 | 95.00 | 97.18 | 2.18 | 0.13 | 121.87 | 1.69 | 131.82 |
| 128.31 | 132.00 | 3.69 | 1.27 | 40.31 | 1.79 | 139.37 |
Au Eq and Ag Eq values have all been adjusted to the silver-to-gold ratio of 78:1 for this news release.
Tarn Lake
Assay results from the maiden drill program at Tarn Lake have already defined an 80m-long open-ended trend of Au mineralization that dips west-northwest (Figures. 1, 7 and 8). Rock chip sample results suggest that Au mineralization extends up-dip from the drill holes to the surface. Mineralization remains open down-dip.
Sulfide mineralization intercepted by drilling is dominantly replacement-style and stockwork-style (Figure 9), and is hosted by intensely altered Eskay rhyolite. This style of mineralization and intense hydrothermal alteration are consistent with a position in the immediate sub-seafloor environment of a VMS feeder zone. Geological mapping, drilling, and lithological facies analyses show extensive rhyolite-bearing volcaniclastic debris flow beds, peperitic rhyolite, and flow-banded rhyolite defining a rhyolite dome complex that formed at a paleoseafloor position proximal to a syn-volcanic VMS feeder structure, supporting the interpretation based on mineralization and alteration. Based on this geology, Eskay’s exploration team thinks there is considerable potential for the presence of seafloor-hosted VMS mineralization at one or more horizons at Tarn Lake, as is seen along the parallel Eskay Creek-Sib-Lulu trend to the west (Figure 10).
Eskay’s geological mapping team has determined that the stratigraphic younging direction along the Scarlet-Tarn trend is to the west, and that the contact between the Eskay rhyolite and the Willow Ridge basalt lies to the west of Tarn Lake (Figure 10). The contact between these lithologies defines the Contact mudstone horizon that hosts the world-class Au-Ag mineralization at Eskay Creek Mine. Given that recent rock chip sampling indicates Au mineralization continues west of Tarn Lake, it is possible the Tarn VMS system continues up-stratigraphy to the Contact mudstone horizon. These findings are a significant step towards our goal of finding Eskay Creek-like VMS deposits on the Consolidated Eskay Property.
In addition to the potential for Au and Ag mineralization down-dip and up-section from 2022 drilling, there is considerable potential for mineralization to extend beneath Bruce Glacier to Scarlet Knob along east-west trending feeder structures (Figure 11). These feeder structures are delineated by andesite dikes surrounded by sulfide mineralization and intense hydrothermal alteration of the host Eskay rhyolite.
Significant drill results from hole TN22-8 completed at Tarn Lake are presented in the table below.
| Hole | From (m) | To (m) | Length (m) | Au (gpt) | Ag (gpt) | Au Eq (gpt) | Ag Eq (gpt) |
| TN22-8 | 90.19 | 92.88 | 2.69 | 0.75 | 29.00 | 1.12 | 87.50 |
| 117.33 | 123.00 | 5.67 | 1.37 | 3.37 | 1.41 | 110.00 | |
| 133.53 | 139.72 | 6.19 | 1.46 | 2.13 | 1.49 | 116.16 | |
| 158.04 | 161.00 | 2.96 | 1.27 | 4.11 | 1.32 | 102.78 |
Au Eq and Ag Eq values have all been adjusted to the silver-to-gold ratio of 78:1 for this news release.
2022 Exploration Program
The fundamental goal of the 2022 exploration program was to identify new precious metal-rich VMS deposits across the Consolidated Eskay Project through early-stage work including mapping and geochemical sampling, and more advanced work including widely spaced drilling. During the 2022 exploration season, Eskay Mining successfully completed 29,500m of diamond drilling along the TV-Jeff corridor and along the Scarlet Ridge-Tarn Lake trend.
Drill results discussed in this news release come from holes drilled in the vicinity of the TV deposit and the newly discovered Tarn Lake mineralizing system. As of this news release, all assays have returned from the 2022 drill program.
Au Eq and Ag Eq Calculations and True Width
Note on use of Au eq (Au eq=Au+Ag/78) and Ag eq (Ag eq=Au*78+Ag): Mineralization at the TV and Jeff deposits displays similar characteristics and mineralogy to the Eskay Creek deposit and therefore for Au eq, and Au:Ag, a ratio of 78:1 is used and Au eq and Ag eq values are deemed to be reasonable based on assumed gold recovery (84.2%) and silver recovery (87.3%) as reported in the Eskay Creek Project NI 43-101 Technical Report and Prefeasibility Study, British Columbia, Canada, Effective Date: 22 July, 2021, Prepared for: Skeena Resources Ltd., Prepared by: Absence Engineering Canada Inc.
True widths of reported intercepts are not fully understood at this time but given the moderately dipping tabular nature of these deposits and the steep angle of drilling, Eskay geologists estimate true widths represent approximately 70-90% of the reported drill intercept lengths.
QA/QC, Methodology Statement
Halved HQ drill core samples are submitted to ALS Geochemistry in Terrace, British Columbia for preparation and analysis. ALS is accredited to the ISO/IEC 17025 standard for gold assays. All analytical methods include quality control standards inserted at set frequencies. The entire sample interval is crushed and homogenized, 250 g of the homogenized sample is pulped. All samples were analyzed for gold, silver, mercury, and a suite of 48 major and trace elements. Analysis for gold is by fire assay fusion followed by Inductively Coupled Plasma Atomic Emission Spectroscopy (ICP-AES) on 30 g of pulp. Analysis for silver is by fire assay and gravimetric analysis on 30 g of pulp. Mercury is analyzed using the trace Hg Inductively Coupled Plasma Mass Spectroscopy (ICP-MS) method. All other major and trace elements are analyzed by four-acid digestion followed by ICP-MS.
Historical rock chip sample data is sourced from Assessment Report AR19675 by Granges dated February 7, 1990. Eskay Mining is unable to fully verify this data, and it should be treated as such by the reader.
Dr. Quinton Hennigh, P. Geo., a Director of the Company and its technical adviser, a qualified person as defined by National Instrument 43-101, has reviewed and approved the technical contents of this news release.
About Eskay Mining Corp
Eskay Mining Corp (TSX-V:ESK) is a TSX Venture Exchange listed company, headquartered in Toronto, Ontario. Eskay is an exploration company focused on the exploration and development of precious and base metals along the Eskay rift in a highly prolific region of northwest British Columbia known as the “Golden Triangle,” 70km northwest of Stewart, BC. The Company currently holds mineral tenures in this area comprised of 177 claims (52,600 hectares).
All material information on the Company may be found on its website at www.eskaymining.com and on SEDAR at www.sedar.com.
For further information, please contact:
| Mac Balkam | T: 416 907 4020 |
| President & Chief Executive Officer | E: [email protected] |
Neither the TSX Venture Exchange nor its Regulation Services Provider (as that term is defined in the policies of the TSX Venture Exchange) accepts responsibility for the adequacy or accuracy of this release.
Forward-Looking Statements
This Press Release contains forward-looking statements that involve risks and uncertainties, which may cause actual results to differ materially from the statements made. When used in this document, the words “may”, “would”, “could”, “will”, “intend”, “plan”, “anticipate”, “believe”, “estimate”, “expect” and similar expressions are intended to identify forward-looking statements. Such statements reflect our current views with respect to future events and are subject to risks and uncertainties. Many factors could cause our actual results to differ materially from the statements made, including those factors discussed in filings made by us with the Canadian securities regulatory authorities. Should one or more of these risks and uncertainties, such as actual results of current exploration programs, the general risks associated with the mining industry, the price of gold and other metals, currency and interest rate fluctuations, increased competition and general economic and market factors, occur or should assumptions underlying the forward looking statements prove incorrect, actual results may vary materially from those described herein as intended, planned, anticipated, or expected. We do not intend and do not assume any obligation to update these forward-looking statements, except as required by law. Shareholders are cautioned not to put undue reliance on such forward-looking statements.
Table of locations and orientations of drill holes reported in this release
| Hole ID | Easting (m) | Northing (m) | Elevation (m) | Azimuth | Dip | Total Depth (m) |
| J22-123 | 410077 | 6267479 | 530 | 270 | 52 | 485 |
| J22-124 | 410051 | 6267243 | 543 | 270 | 55 | 489 |
| J22-125 | 409816 | 6268745 | 416 | 250 | 50 | 264 |
| TV22-88 | 409501 | 6266788 | 439 | 282 | 45 | 384 |
| TV22-91 | 409675 | 6266449 | 621 | 282 | 45 | 469 |
| TV22-92 | 409627 | 6266109 | 695 | 282 | 45 | 201 |
| TV22-93 | 409686 | 6266197 | 711 | 282 | 45 | 349 |
| TV22-94 | 409675 | 6266449 | 621 | 102 | 78 | 103 |
| TV22-95 | 409590 | 6265980 | 727 | 282 | 55 | 406 |
| TV22-96 | 409590 | 6265980 | 727 | – | 90 | 172 |
| TV22-97 | 409590 | 6265980 | 727 | 217 | 45 | 234 |
| TV22-98 | 409343 | 6265980 | 678 | 282 | 70 | 328 |
| TV22-99 | 409590 | 6265980 | 727 | 190 | 45 | 186 |
| TV22-100 | 409619 | 6266027 | 712 | 282 | 60 | 250 |
| TV22-101 | 409343 | 6265980 | 678 | – | 90 | 161 |
| TV22-102 | 409619 | 6266027 | 712 | 210 | 45 | 75 |
| TV22-103 | 409590 | 6265929 | 750 | 300 | 75 | 150 |
| TV22-105 | 409590 | 6265851 | 792 | 300 | 80 | 150 |
| TV22-106 | 409354 | 6265847 | 736 | 282 | 70 | 103 |
| TV22-108 | 409459 | 6265841 | 773 | 282 | 60 | 444 |
| TV22-109 | 409590 | 6265851 | 792 | 240 | 55 | 189 |
| TV22-110 | 409590 | 6265851 | 792 | 240 | 75 | 253 |
| TV22-111 | 409590 | 6265851 | 792 | 215 | 55 | 202 |
| TV22-112 | 409459 | 6265841 | 773 | – | 90 | 121 |
| TV22-113 | 409590 | 6265851 | 792 | 215 | 75 | 250 |
| TV22-114 | 409324 | 6265755 | 762 | 282 | 45 | 135 |
| TV22-115 | 409590 | 6265851 | 792 | 180 | 55 | 239 |
| TV22-116 | 409541 | 6265719 | 844 | 282 | 55 | 212 |
| TV22-117 | 409590 | 6265851 | 792 | 90 | 70 | 230 |
| TV22-118 | 409902 | 6265721 | 987 | 290 | 49 | 525 |
| TV22-119 | 409585 | 6265763 | 820 | 10 | 55 | 275 |
| TV22-120 | 409585 | 6265763 | 820 | 350 | 55 | 308 |
| TV22-121 | 409585 | 6265763 | 820 | 340 | 65 | 182 |
| TV22-122 | 409585 | 6265763 | 820 | – | 90 | 203 |
| TV22-123 | 409585 | 6265763 | 820 | 200 | 45 | 202 |
| TN22-04 | 415102 | 6273575 | 1470 | 100 | 55 | 123 |
| TN22-05 | 415165 | 6273652 | 1444 | 87 | 55 | 113 |
| TN22-07 | 415165 | 6273652 | 1444 | 50 | 55 | 155 |
| TN22-08 | 415102 | 6273575 | 1470 | 125 | 70 | 163 |
| TN22-09 | 415165 | 6273652 | 1444 | 80 | 70 | 208 |
| TN22-11 | 415165 | 6273652 | 1444 | – | 90 | 127 |
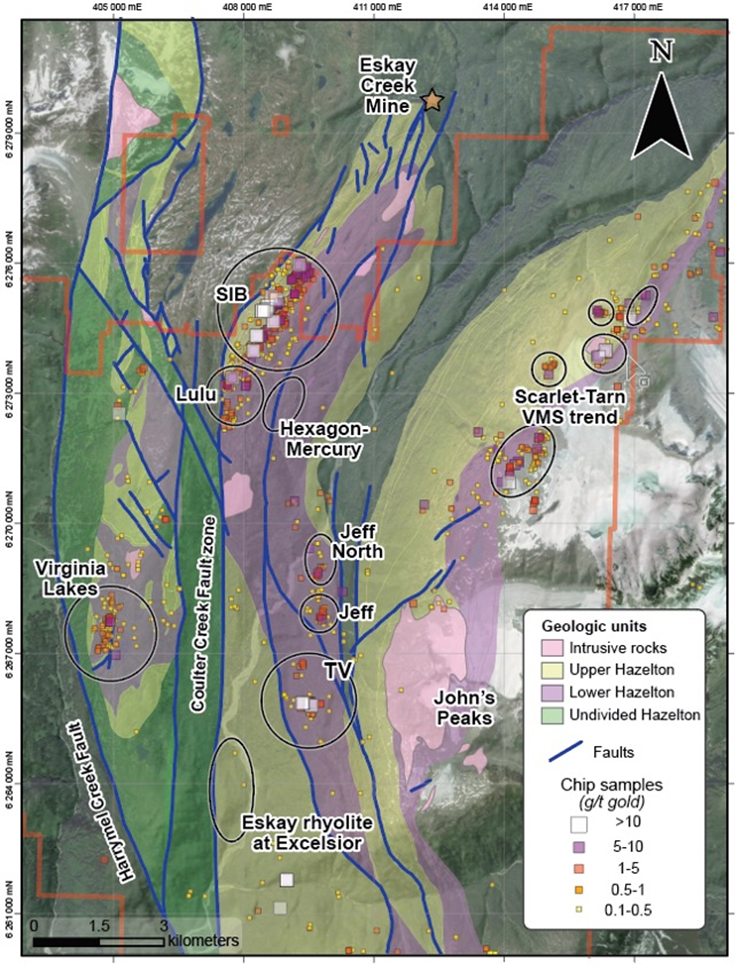 Figure 1: Geologic map showing a new interpretation for the distribution of mineralized stratigraphy of the Eskay Creek area with gold in surface samples. Map displays correlative domains where upper Hazelton Group Eskay rhyolite is host to VMS mineralization along the Scarlet-Tarn trend. Also labeled are VMS showings along extensions of the Eskay Anticline to the south at SIB-Lulu, Hexagon-Mercury, TV-Jeff, and Excelsior.
 Figure 2: Map showing locations of 2022 drill collars and traces, and Au assay results for recent and legacy rock chip samples at TV. Mineralization is concentrated in the zone marked by the ellipse, and extends from the surface down-dip ~150 m. The cluster of high-grade samples near TV22-106 and TV22-108 suggest this extension of the stockwork zone may contain higher grade pockets of Au and Ag mineralization.
Figure 3: Map and cross-section views of TV showing drill hole and rock chip assay results. Cross-sections are shown in the continuation of this figure below, and are 100 m thick along east-west lines spaced 50 meters apart. Assay results for 2022 drill holes are shown in bold, with results from 2020-2021 drilling shown as fine lines. Drilling in 2022 expanded the footprint of the Upper Massive Sulfide Zone northwards and down-dip with respect to 2020-2021 drilling, giving this zone minimum dimensions of ~100 m along strike, ~150 m down-dip to the east, and a true thickness of ~ 5-10 m. The footprint of the Stockwork Zone was expanded down-dip to the east, and up-dip to the west with respect to 2020-2021 drill holes, giving this zone dimensions of ~175 m along strike, 170 m down-dip, and a true thickness ranging from ~50-100 m. Recent and legacy rock chip sample results suggest that the up-dip part of the Stockwork Zone may contain high-grade pockets of Au and Ag mineralization within a zone of strongly anomalous Au and Ag mineralization.
 Figure 4: Representative intercept of massive sulfide from TV22-109 50.47-62.72 m, showing the association of sulfide mineralization with intensely silicified mudstone and peperitic dacite.
 Figure 5: TV22-105 87.41-97.27 m showing semi-massive and stockwork sulfide mineralization hosted by intensely silicified mudstone, with overlying dacite breccia
 Figure 6: TV22-120 133.81-146.20 m showing stockwork sulfide mineralization hosted by intensely silicified mudstone. This style mineralization is identical to that intercepted by drill holes TV21-63, TV21-66, and TV21-67, with the later hole ranging from 25-40 m up-dip from TV22-120. TV22-120 was drilled sub-parallel to strike and does not represent true thickness.
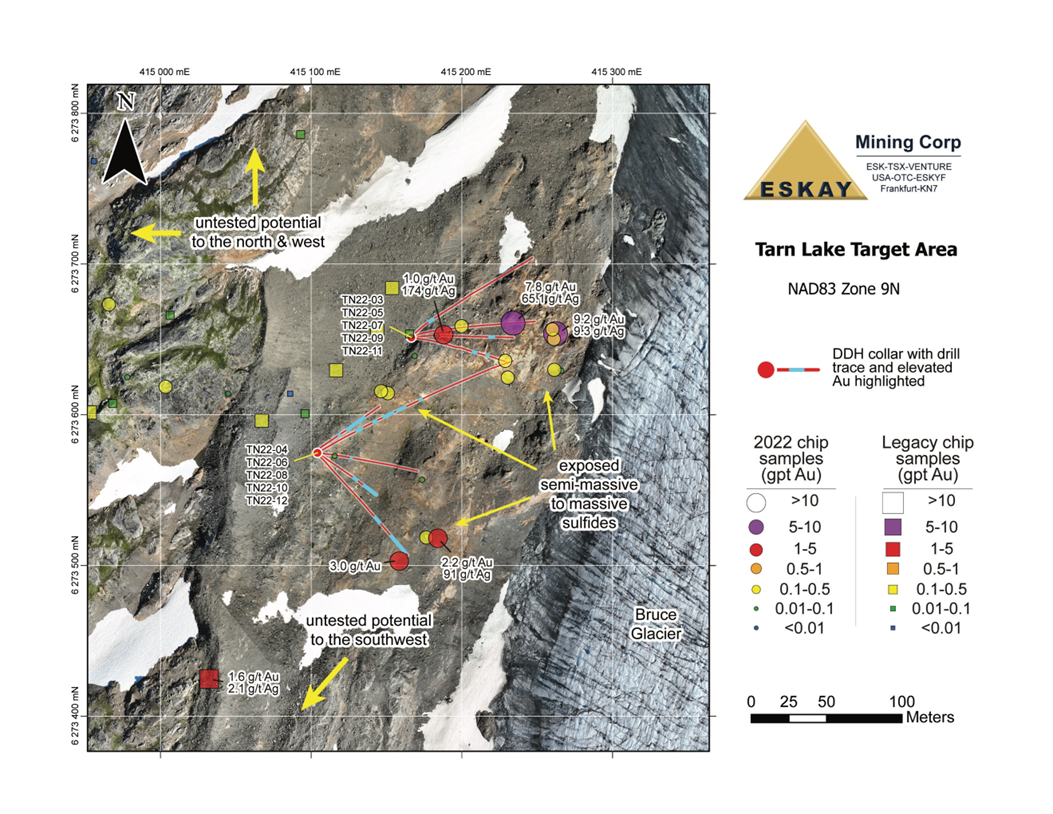 Figure 7: Map of Tarn Lake showing drone imagery, 2022 drill traces with Au-bearing intercepts highlighted in blue, and Assay results with locations for legacy and 2022 rock chip samples.
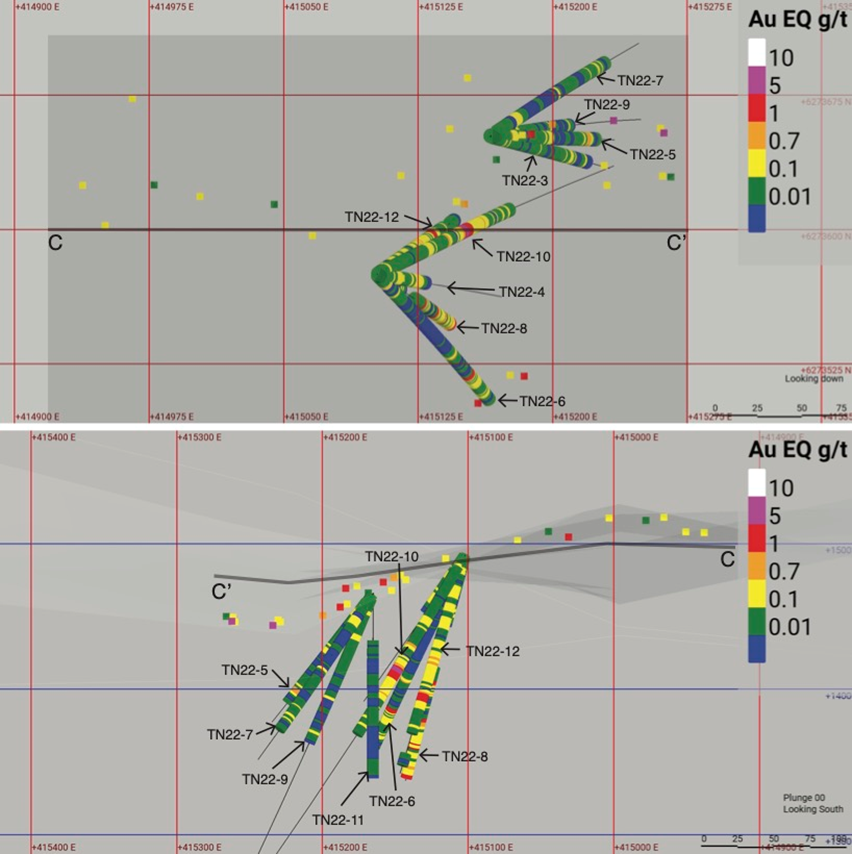 Figure 8: Assay results from the maiden drill program and rock chip sampling at Tarn Lake. The top figure is a map view showing the location of the 200 m thick cross-section C-C’ at bottom. Drill holes TN22-10, TN22-12, TN22-8, and TN22-6 define an 85 m long trend of Au mineralization along strike. Drilling combined with rock chip sampling indicate a west-northwest dipping zone of mineralization extending from the surface ~75 m down-dip. Mineralization is open down-dip. Eskay’s mapping team has determined that the stratigraphic younging direction is to the west. This, combined with the Au-bearing rock chip samples to the west indicate VMS mineralization continues up-stratigraphy.
 Figure 9. TN22-8 133.33-141.36 showing representative stockwork mineralization hosted by Eskay rhyolite. The interval shown contains the 6.19 m intercept grading 1.49 g/t Au equivalent, and shows that rock with relatively low sulfide abundance contains appreciable gold, suggesting strong enrichment of gold with respect to sulfide minerals.
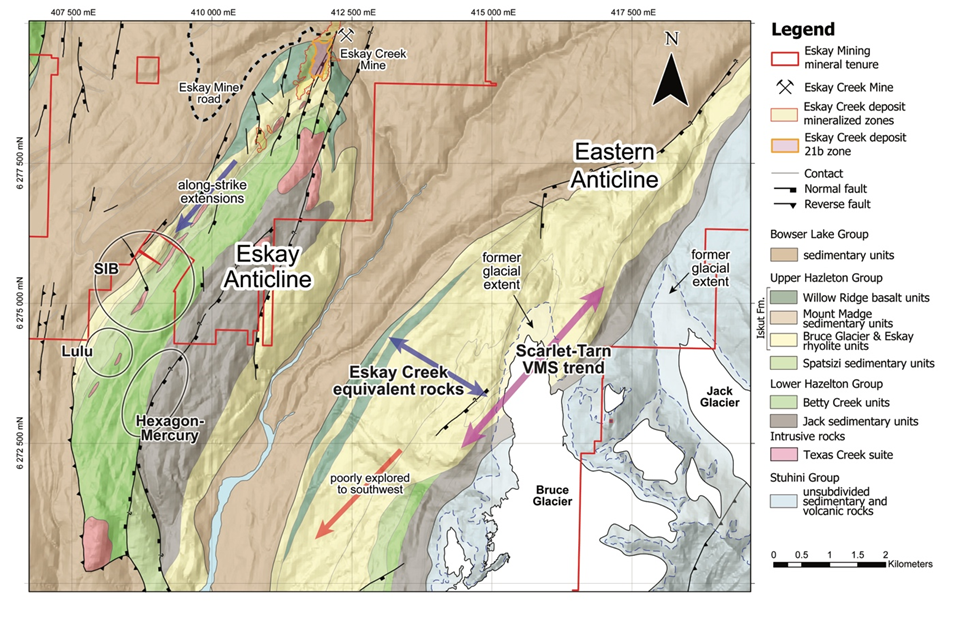 Figure 10: Geological map showing the Eskay anticline and Scarlet-Tarn trends of VMS mineralization. Geological mapping of the Scarlet-Tarn trend by Eskay’s team in 2022 has determined that the stratigraphic younging direction is to the west, and that the Eskay rhyolite host to mineralization at Tarn Lake is overlain by Willow Ridge basalt to the west. The contact between these two lithologies define the Contact mudstone horizon, the host to the world-class mineralization at Eskay Creek mine. This finding is a significant step towards our goal of finding Eskay Creek-like VMS deposits.)
 Figure 11: Cross-section view of Tarn Lake and Scarlet Knob looking due south, showing assay results for 2022 drill holes and rock chip samples. Mineralization at both showings is hosted the Eskay rhyolite, and is focused along east-west trending andesite dikes that likely represent the syn-volcanic feeder structures that fed VMS mineralization in the area. Given that mineralization is focused along east-west trending structures, and the high Au and Ag grades from rock chip samples along the margins of Bruce Glacier, it is possible that mineralization extends under Bruce Glacier and connects Tarn Lake and Scarlet Knob.)


