Chart of the Day: Déjà vu?
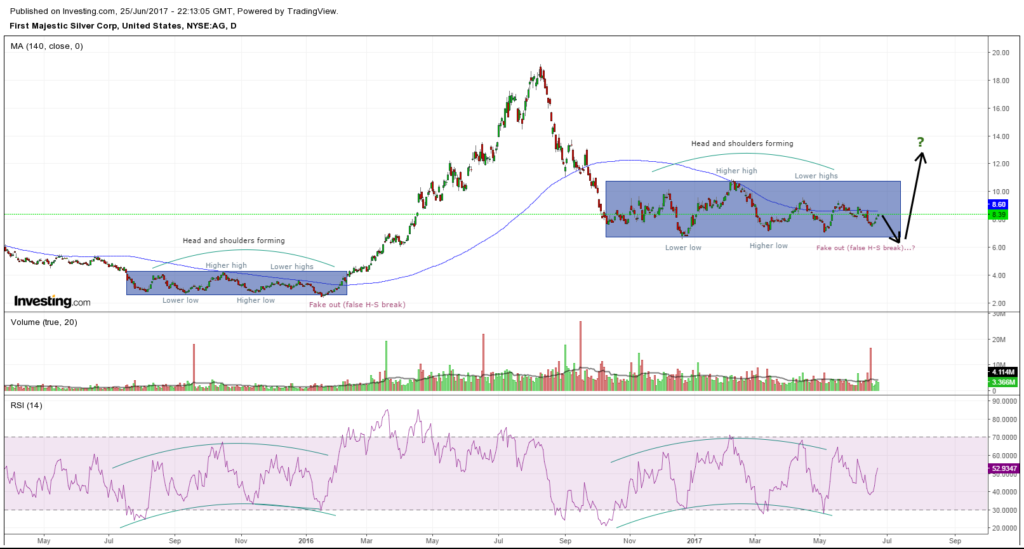
At the start of the monstrous leg up in the miners early 2016 one of the most explosive mining stocks out there was First Majestic Silver Corp, which rose over 500% before a severe correction took hold. Many people has probably seen the graph of the miners long and tedious consolidation pattern that went on for about six months before the “final” leg down took place. After going over the recent trading action in First Majestic I realized it seemed to have many things in common with the previous consolidation pattern…
Below is a graph of some interesting similarities between then and now:
.They say history doesn’t repeat, but it rhymes…
If this newest consolidation pattern would play out in a similar way, we would be looking for a last and painful leg down (shake out), before this stock would be rocketing higher again, just like in 2016. Extrapolated to the whole sector, that would probably mean that the year long wedge pattern in GDX and GDXJ would also do a last leg down before turning up. Ergo, a false bearish break that inflicts the most pain and fear into the hearts of retail investor, all while smart money are picking up miners at fire sale panic prices (just like last time). Judging by the latest COT-report, the commercials seem more positioned for a bigger rally than an extended and deep correction. As always, nothing can be taken for granted, but I can’t deny that there are some interesting clues in First Majestic’s chart in terms of smart money perhaps trying to recreate the recipe for max fear once again.
Ps. I don’t see many chartists on twitter or elsewhere that are decidedly bullish on the metals and miners either (#ContrarianHope)


