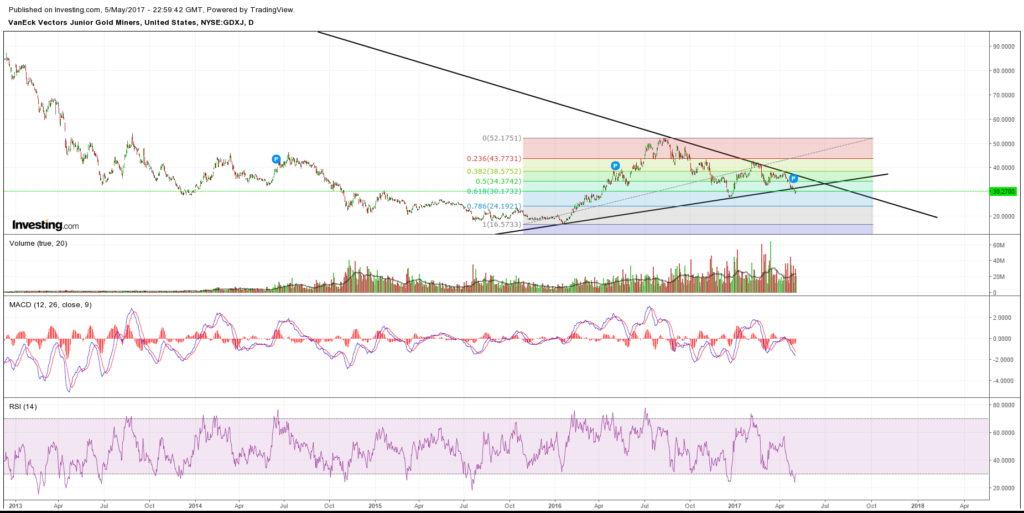
Chart of the Day: GDXJ
The miners have taken a real beating over the last couple of weeks, and as of now GDXJ (Junior miners) are below the floor of the giant wedge formation (Bearish)…
Notes:
- Below wedge floor (Bearish unless it’s a fake break, which in that case would be super bullish instead).
- Price currently sitting at 0.618 Fibonacci Retracement (Potential support zone).
- Daily RSI deeply oversold (Should create a bounce at least soon).
At this point in time, the picture sure looks bearish when it comes to the junior miners on the back of silver having it’s worst loss streak EVER. I doubt there are many traders and/or investors that can look at a chart like this and consider it to be a good entry point. The problem with markets is that at turning points, it will often look super bullish or bearish respectively. At the start of the massive up leg in metals and miners that started Q1 2016, the miners first broke down below the price floor that had held for many months. Thus, the absolutely best entry point possible in the miners were when the chart looked the most bearish (below support zones and trend lines).
Some chartists are looking for silver to revisit it’s multi year low of $13.50, others are waiting for the next massive up leg to start sooner rather than later. To say that we are in no mans land ATM is thus an understatement. In the mean time, one can only hope for the best and for long term bulls to use “excessive” drawdowns in miners etc to accumulate.
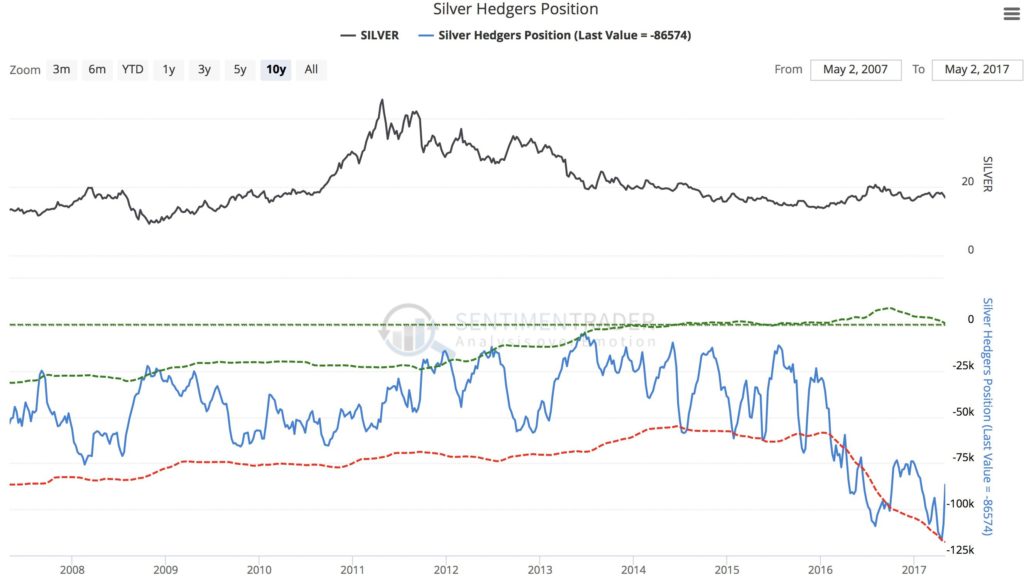
Below is the latest COT-report for silver, which shows a decent amount of short covering by the commercials. But it is still looks pretty bearish compared to historic levels:


