Four Big Charts For Gold
Look at these four long term charts and see if an interesting picture starts to materialize…
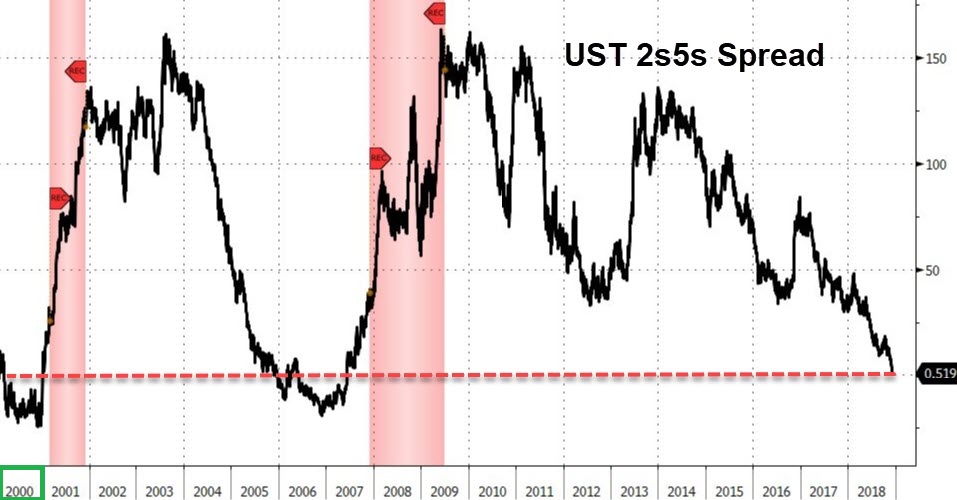
- Long Term UST 2s4s Spread:
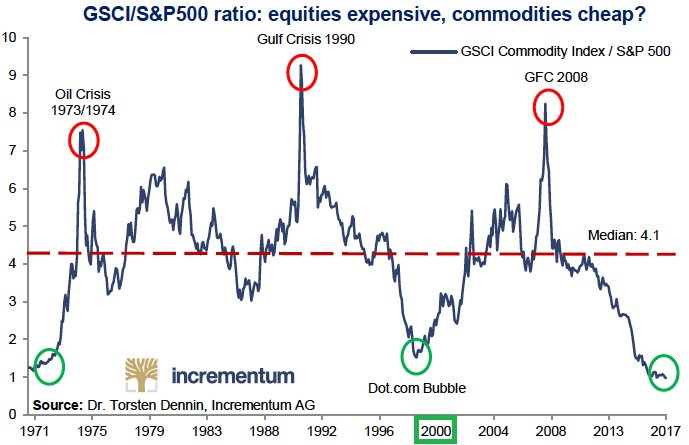
- Long term Commodities versus US Equities (S&P 500) Ratio :
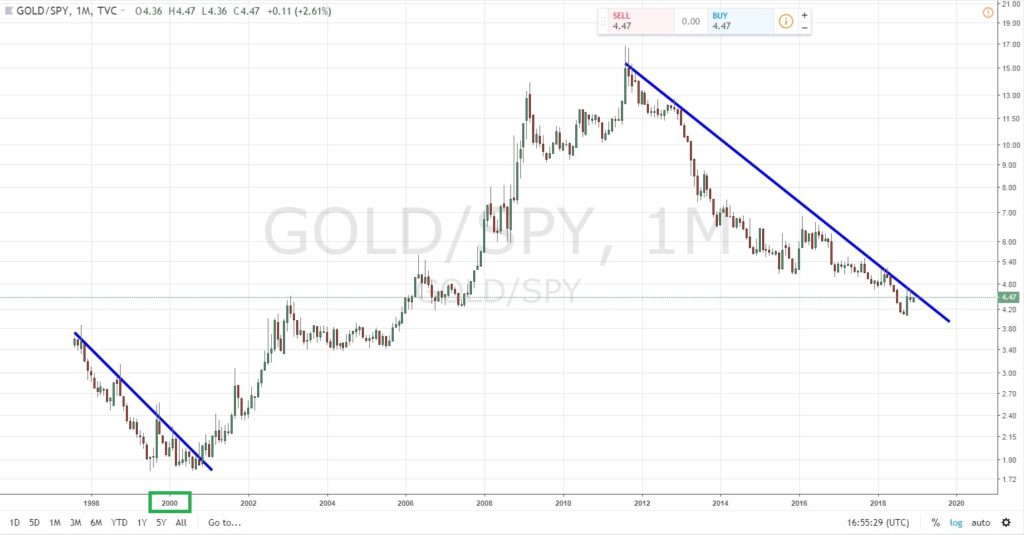
- Long Term Gold/SPY (S&P500) Ratio:
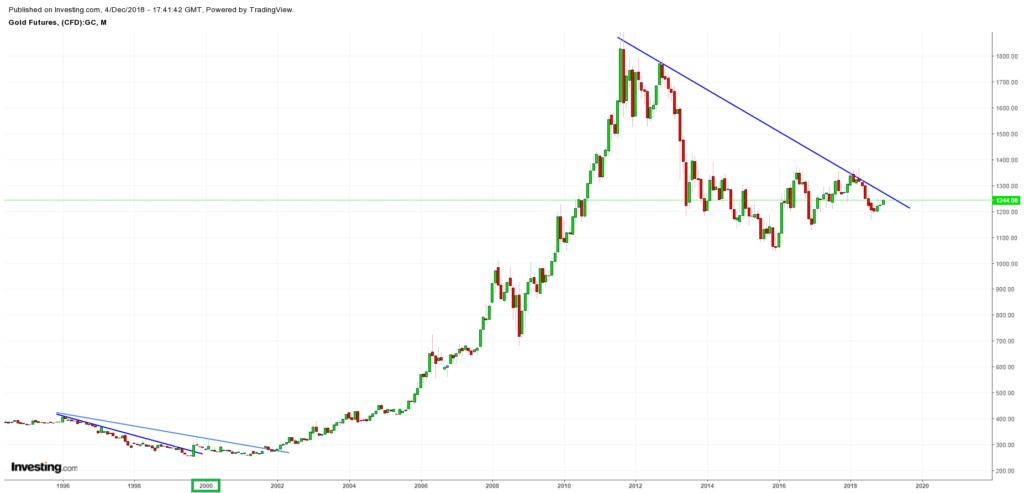
- Long Term Gold Chart:
… Sure looks like some generational starts are lining up, akin to around the year 2000, before gold began a 10 year bull run.
Best regards,
The Hedgeless Horseman
Follow me on twitter: https://twitter.com/Comm_Invest
Follow me on CEO.ca: https://ceo.ca/@hhorseman
Don’t forget to sign up for my Newsletter (top right on front page) in order to get notification when a new post is up!
If you want to learn more about Novo Resources and the Pilbara Gold Rush you can purchase all my premium content HERE.
If you find my work valuable and want to help me keep publishing most of my research for free then please consider making a donation.


