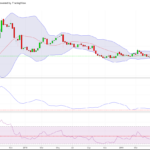
Just an observation of some chart similarities between now and 2017: … Now a zoomed in view of the indicators, just to show how similar they really are: The BBW indicator which measures volatility has only been this low one other...
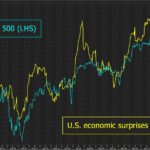
Continue reading » August 22, 2019 admin Chart of the Day No Comment BIG divergence between the stock market and the underlying fundamentals: Margin debt at all time highs: “Irrational exuberance” indicator at highest point since at least 2001: To sum up: There are bubble warning signs pretty much everywhere one bothers to look. This...
Continue reading » June 21, 2017 admin Chart of the Day, Market Flash No Comment 


