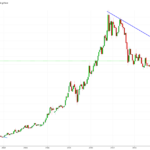
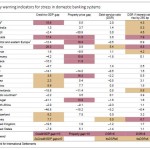
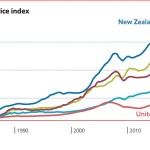
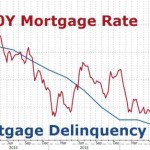
Look at these four long term charts and see if an interesting picture starts to materialize… Long Term UST 2s4s Spread: Long term Commodities versus US Equities (S&P 500) Ratio : Long Term Gold/SPY (S&P500) Ratio: Long Term...
Continue reading » December 4, 2018 admin Chart of the Day, Gold No Comment Lets take a look at the correlations during the time period 2017-03-01 to 2017-05-01: Data Observations GDXJ correlation with gold literally went down the drain, with a coefficient of only 0.06! Probably a lot to do with the GDXJ rebalancing. Gold saw...
Continue reading » May 2, 2017 admin Market Flash No Comment Note: Real rates are calculated by taking the rate of inflation and subtract interest rate. If real rates are negative, it means that your purchasing power declines even if you deposit your currency in a “savings” account. Precious metals love negative real rates because of...
Continue reading » March 19, 2017 admin Market Flash No Comment This is what you get with ultra low to negative rates. Real rates are even worse in many developed countries. Noone wants to save in a bank when you can buy real assets with maximum leverage at record low rates. When rates go up,...
Continue reading » March 17, 2017 admin Market Flash No Comment The FED is in a tough spot to say the least. After years of QE and zero interest rates in order to try to get inflation kick started, it seems they may finally get what they wished for… Now the BIG problem for the FED...
Continue reading » February 15, 2017 admin The Economic Depression No Comment 