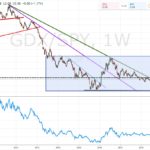
I suppose the miners won’t see fireworks (big inflows) until the dotted line is broken:
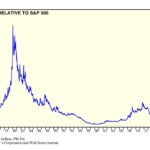
Continue reading » February 9, 2019 admin Chart of the Day, Gold & Silver Stocks No Comment Look at these four long term charts and see if an interesting picture starts to materialize… Long Term UST 2s4s Spread: Long term Commodities versus US Equities (S&P 500) Ratio : Long Term Gold/SPY (S&P500) Ratio: Long Term...
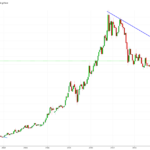
Continue reading » December 4, 2018 admin Chart of the Day, Gold No Comment … Which one would you consider a bargain ATM?
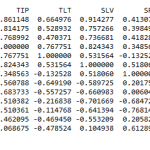
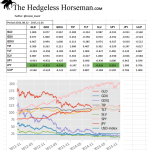
Continue reading » April 23, 2017 admin Market Flash No Comment I was interested in examining the changes in cross-asset correlations for the months leading up to the elections versus the correlations after the election, ergo before and after “The Trump Hype” aka “The Reflation Trade”. Additional background reading: “Morgan Stanley: A ‘correlation crash’ is happening in...
Continue reading » April 8, 2017 admin Gold, Gold & Silver Stocks No Comment I was interested to see what the correlation was between different assets and asset classes during the period from when gold topped 2011, to when it bottomed 2015. I just had to include the Yen (USD/JPY) since more and more people are noticing its seemingly...
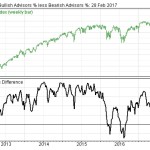
Continue reading » April 3, 2017 admin Silver & Guld 2 Comments Setting the scene… ( S&P500): As the US stock indices have almost gone vertical I thought it might be interesting to map just how euphoric investors are today… Yesterday the largest S&P500 ETF saw the second biggest inflow in over 5 years....
Continue reading » March 2, 2017 admin Market Flash No Comment 