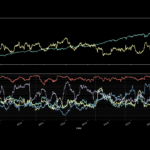
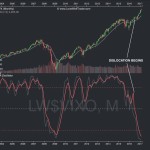
I have been coding a lot these last few weeks and I have created a script that tracks rolling correlations for a given asset. I also created a “Psychology/Dislocation Index” in order to measure how dislocated an asset is from some of the typical asset...
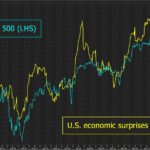
Continue reading » January 16, 2018 admin Chart of the Day, Uncategorized No Comment BIG divergence between the stock market and the underlying fundamentals: Margin debt at all time highs: “Irrational exuberance” indicator at highest point since at least 2001: To sum up: There are bubble warning signs pretty much everywhere one bothers to look. This...
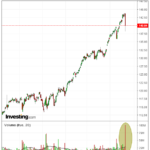
Continue reading » June 21, 2017 admin Chart of the Day, Market Flash No Comment Nasdaq began to drop on massive volume during the latter part of the day. It was even and heavy selling across the board, including the ultra caps such as Facebook, Amazon, Netflix, Google (FANG) and Apple.
Continue reading » June 9, 2017 admin Horseman's Portfolio No Comment “Retail Investor Euphoria Sign of Looming Market Bubble” – Schiffgold.com “Deep Subprime Auto Loans Are Surging“ – Bloomberg.com “Foundation – Fall of The American Galactic Empire” – Theburningplatform.com “Two Fed Presidents Warn Markets Getting Frothy, Valuations May Come Down” – Zerohedge.com “Something’s Broken In The...
Continue reading » March 29, 2017 admin Market Flash No Comment 


