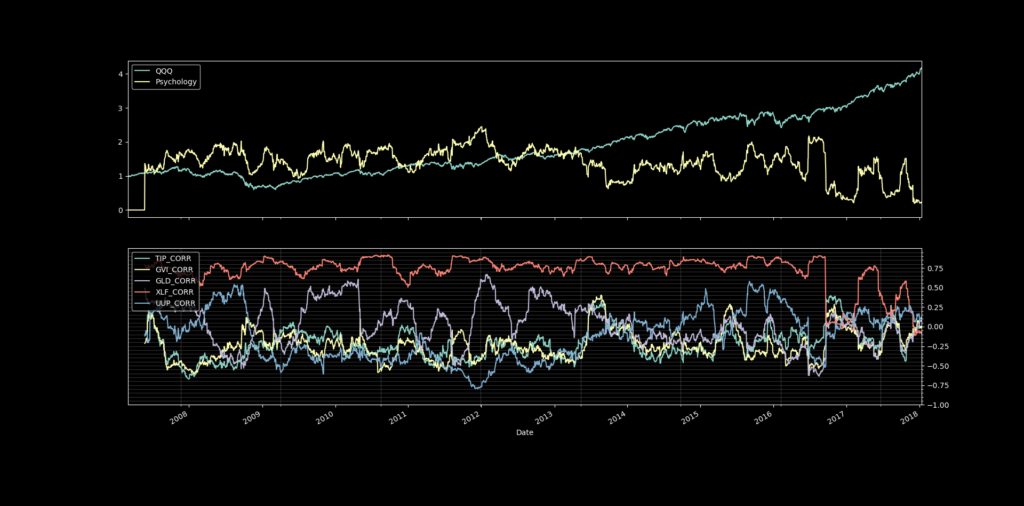
Chart of The Day: Nasdaq (QQQ)
I have been coding a lot these last few weeks and I have created a script that tracks rolling correlations for a given asset. I also created a “Psychology/Dislocation Index” in order to measure how dislocated an asset is from some of the typical asset classes that might influence it. Currently, the index is at an 10 year low for QQQ (Nasdaq). I guess this next chart helps to point out just how euphoric the current parabolic movements in the Nasdaq really are. The Nasdaq really started to dislocate after the Trump win in late 2016. Notice also how the correlations are currently converging at zero:
Best regards,
The Hedgeless Horseman
Follow me on twitter: https://twitter.com/Comm_Invest
Follow me on CEO.ca: https://ceo.ca/@hhorseman
Don’t forget to sign up for my Newsletter (top right on front page) in order to get notification when a new post is up!


